 Zoho team today introduced an online Database & Reporting application (Zoho DB and reports).
Zoho DB comes with a simple spreadsheet like user interface. You can create online databases and analyze your data using different views and charting tools. You can start by creating a database from an existing XLS/CSV/TSV files or by creating blank database. Once you have the data in the database, you can create different views and do visual analysis on the data in your database.
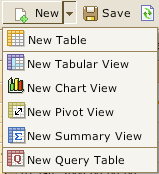
Zoho DB lets you create multiple types of views - Tabular View, Chart View, Pivot View,
 Summary View etc from the ‘New’ button.
One of the core functionalities of Zoho DB is Data Visualization. The ‘Chart View’ option enables you to visualize your data in simple charts. This complex functionality is simplified with a very simple Drag-n-Drop interface. You have to play with it to really know the power of this feature.
This Drag-n-drop interface is also extended to creating ‘Pivot Tables’ in Zoho DB.
One of the unique features of Zoho DB is the ability to run SQL Queries of ANY dialect on the data. It understands SQL Queries/dialects from any of the supported databases which include Oracle, SQL Server, DB2, Sybase, MySQL, PostgreSQL, Informix and ANSI SQL. So you can run the SQL queries you already know on Zoho DB data to create custom tables or reports.
Ofcourse, once you have all the tables, views, charts etc created, you can share them with appropriate permissions or make them public (checkout existing public databases). You can also embed these views and charts on your website or blogs.
No comments:
Post a Comment